few elements from Matlab programming related to basic 2D frequency filtering
Course homepage: http://cmp.felk.cvut.cz/cmp/courses/ZSO

-------------------------------------------------------------
few elements from Matlab programming related to basic 2D frequency filtering
Course homepage: http://cmp.felk.cvut.cz/cmp/courses/ZSO
-------------------------------------------------------------
clear all
you may use your own or download from: http://cmp.felk.cvut.cz/cmp/courses/ZSO/Images
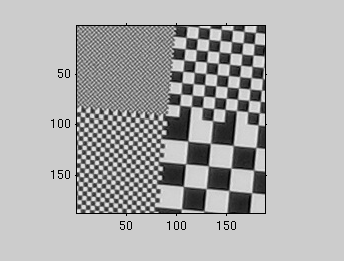
im = rgb2gray(imread('pattern2_cropped.png'));
[im_height,im_width] = size(im);
figure, imshow(im), axis on
F = fftshift(fft2(double(im)));
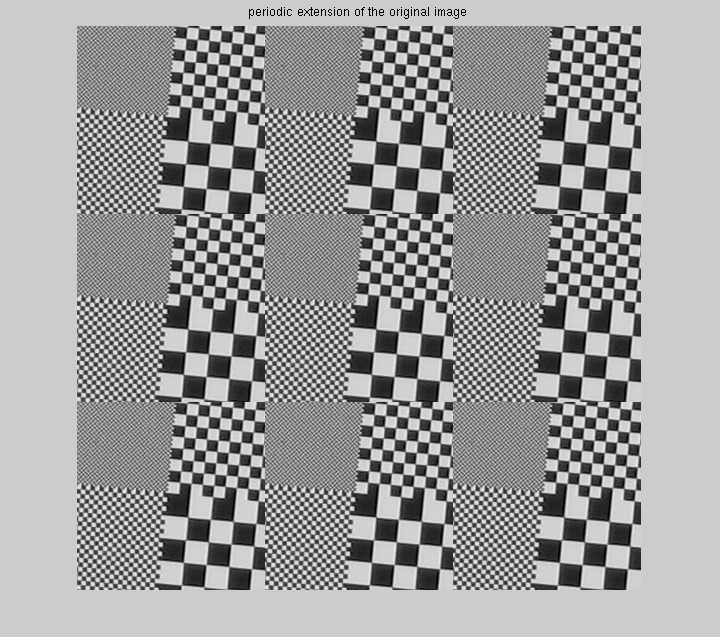
Remember that using Discrete Fourier Transfrom that functions (images) are infinite periodic. To avoid interference between adjacent periods it is necessary to do zero paddings. Sometimes is does not matter, try the image pattern2.png from http://cmp.felk.cvut.cz/cmp/courses/ZSO/Images. You may download the function paddedsize from http://cmp.felk.cvut.cz/cmp/courses/ZSO/Codes
periodic_im = [im,im,im; im,im,im; im,im,im];
figure, imshow(periodic_im), title('periodic extension of the original image')
ps = paddedsize(size(im),'PWR2');
F_padded = fftshift(fft2(double(im),ps(1),ps(2)));
you may download the function rc2uv from http://cmp.felk.cvut.cz/cmp/courses/ZSO/Codes
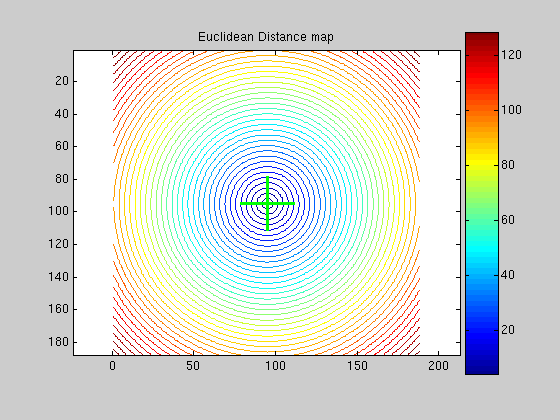
[U,V] = rc2uv(im_height,im_width);
D = sqrt(U.^2+V.^2); % distance matrix
figure,
[C,h]=contour(D,40); hold on;
% find the point of zero distance
[mid_r,mid_c] = find(D==0);
plot(mid_c,mid_r,'g+','MarkerSize',50,'LineWidth',3)
axis ij; axis equal;
colormap jet; colorbar;
title('Euclidean Distance map')
% the same for padded version
[U_padded,V_padded] = rc2uv(ps(1),ps(2));
D_padded = sqrt(U_padded.^2 + V_padded.^2);
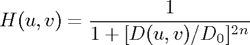
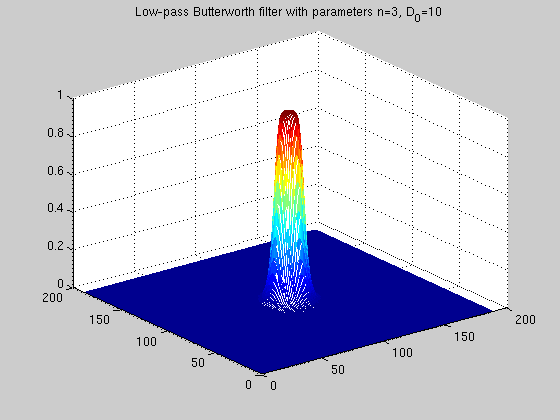
n = 3; Do = 10; %filter parameters
H = 1./( 1+(D./Do).^(2*n) );
figure; mesh(H);
title(sprintf('Low-pass Butterworth filter with parameters n=%d, D_0=%d',n,Do))
% the same for the padded version
% scale the threshold
Do_padded = Do*(ps(2)/im_width);
H_padded = 1./( 1+(D_padded./Do_padded).^(2*n) );
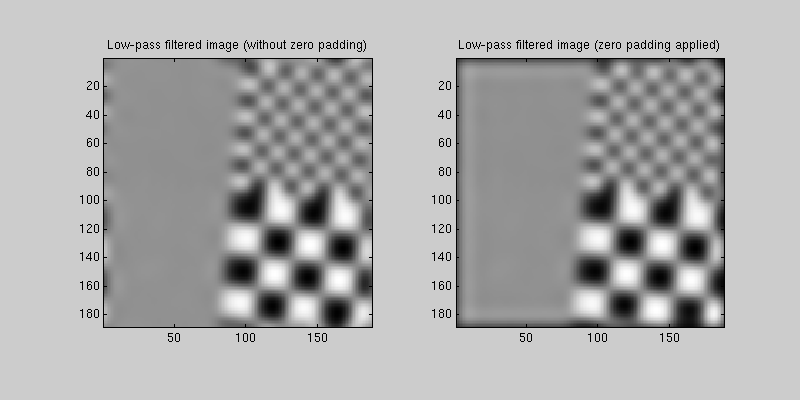
% H.*F means per-element multiplication
G = H.*F;
G_padded = H_padded.*F_padded;
% back to spatial representation
g = real(ifft2(fftshift(G)));
g_padded = real(ifft2(fftshift(G_padded)));
% crop out the real image from the padded version
g_padded = g_padded(1:im_height,1:im_width);
figure('Position',[0,0,800,400]);
subplot(1,2,1)
imagesc(g); axis equal; axis on; axis tight; colormap(gray(256));% colormap(jet(256)); colorbar;
title('Low-pass filtered image (without zero padding)')
subplot(1,2,2)
imagesc(g_padded); axis equal; axis on; axis tight; colormap(gray(256));% colormap(jet(256)); colorbar;
title('Low-pass filtered image (zero padding applied)')
drawnow;
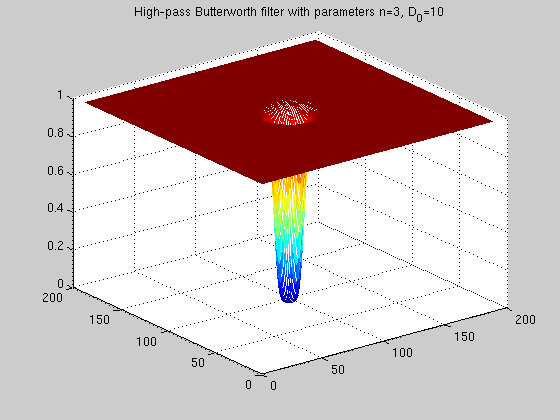
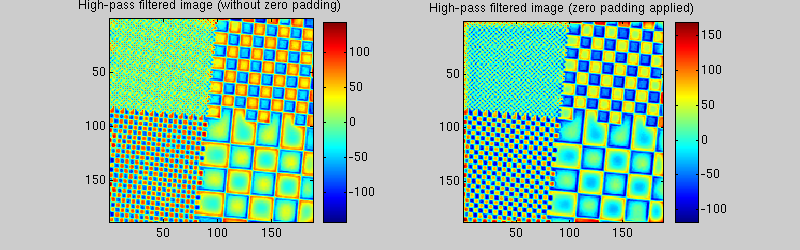
% from low-pass to high-pass filter
H = 1-H; H_padded = 1-H_padded;
figure; mesh(H);
title(sprintf('High-pass Butterworth filter with parameters n=%d, D_0=%d',n,Do))
G = H.*F; G_padded = H_padded.*F_padded;
% back to spatial representation
g = real(ifft2(fftshift(G)));
g_padded = real(ifft2(fftshift(G_padded)));;
% crop out the real image from the padded version
g_padded = g_padded(1:im_height,1:im_width);
figure('Position',[0,0,800,250]);
subplot(1,2,1)
imagesc(g); axis equal; axis on; axis tight; colormap(jet(256)); colorbar;
title('High-pass filtered image (without zero padding)')
subplot(1,2,2)
imagesc(g_padded); axis equal; axis on; axis tight; colormap(jet(256)); colorbar;
title('High-pass filtered image (zero padding applied)')
drawnow;