few elements from Matlab programming related to basic 2D frequency analysis
Course homepage: http://cmp.felk.cvut.cz/cmp/courses/ZSO -------------------------------------------------------------
clear all
% hint: try different cutoff values and observe differences
cutoff = 5;
im_c = 256;
im_r = 256;
% just auxiliary structure
[ix,iy] = rc2uv(im_c,im_r);
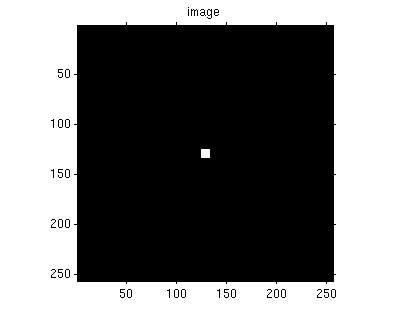
square image
im_im = zeros(im_r,im_c);
im_im(abs(ix)<cutoff & abs(iy)<cutoff) = 1;
figure(1); clf
imshow(im_im);
axis on
title('image')
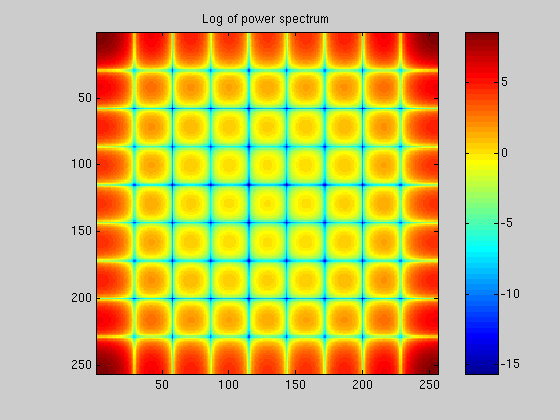
fourier spectrum
im_fft = fft2(im_im);
% power
im_Pfft = abs(im_fft.^2);
% log of power, avoid log of zeros
im_logPfft = log(im_Pfft+eps);
figure(2); clf
imagesc(im_logPfft), axis image;
colorbar
title('Log of power spectrum')
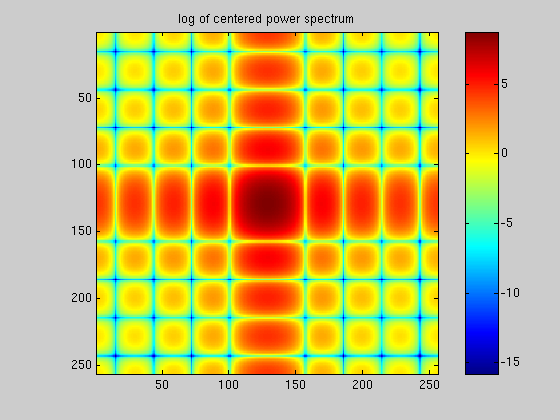
low frequencies are close to the center direct component in the middle
figure(3); clf
imagesc(fftshift(im_logPfft)), axis image;
colormap(jet(256))
colorbar
title('log of centered power spectrum')
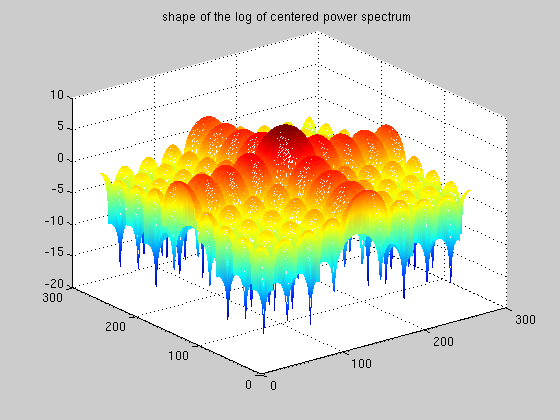
sometimes is useful to see the "shape" of the spectrum
figure(4); clf
mesh(fftshift(im_logPfft))
shading interp
title('shape of the log of centered power spectrum')