Contents
clear all;

data.xRect = [ 290 290 230 230]; data.yRect = [ 170 200 200 170];
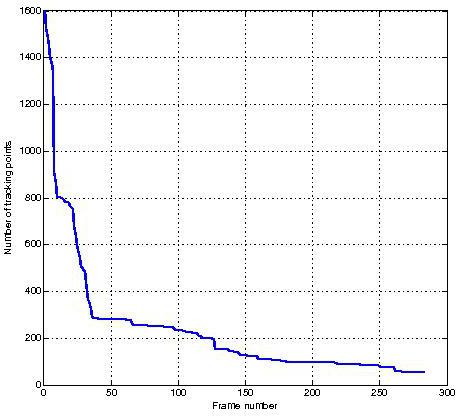
vyvoj poctu bodu
if (exist('homography.mat','file'))
load ('homography.mat');
if (isnumeric(xHistory.ID))
IDs = unique(xHistory.ID); nums = zeros(size(xHistory.ID));
for a = IDs'; nums(a) = sum(xHistory.ID == a); end;
nums = nums(nums~=0); counts = zeros(max(nums),1);
for a = 1:max(nums); counts(a) = sum(nums>=a); end;
figure; plot(counts,'LineWidth',2); xlabel('Frame number'); ylabel('Number of tracking points'); ylim([0, round(length(IDs)*50)/50 ]); grid on;
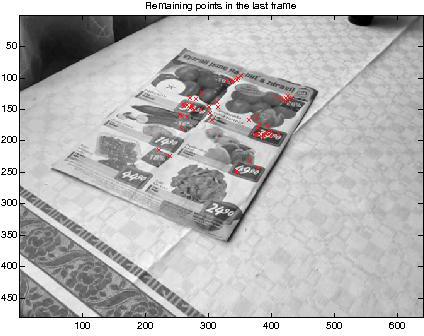
img = im2double(rgb2gray(imread('billa_jpg_283.jpeg')));
figure; imagesc(img); colormap gray; axis image; hold on;
plot(xHistory.x(end-counts(end)+1:end),xHistory.y(end-counts(end)+1:end),'Color',hsv2rgb(0,0.9,1),'Marker','x','LineStyle','none');
title('Remaining points in the last frame');
else
fprintf('Bad xHistory format\n\n');
end
else
fprintf('Result file homography.mat not found\n\n');
end
homografie dle odevzdaneho .mat souboru
if (exist('homography.mat','file'))
load ('homography_ref.mat'); hHistoryRef = hHistory; xHistoryRef = xHistory; load ('homography.mat');
H = eye(3);
for a = 1:length(hHistory); H = (hHistory{a}./hHistory{a}(3,3)) * H; end
Href = eye(3);
for a = 1:length(hHistoryRef); Href = (hHistoryRef{a}./hHistoryRef{a}(3,3)) * Href; end
fprintf('Your homography result:\n'); disp(H/H(3,3));
fprintf('Our homography result:\n'); disp(Href/Href(3,3));
tmp = H * [data.xRect; data.yRect; ones(size(data.xRect))];
dataOut.xRect = tmp(1,:)./tmp(3,:); dataOut.yRect = tmp(2,:)./tmp(3,:);
fprintf('Your transformed rectangle:\n'); disp([dataOut.xRect; dataOut.yRect]);
tmp = Href * [data.xRect; data.yRect; ones(size(data.xRect))];
dataRef.xRect = tmp(1,:)./tmp(3,:); dataRef.yRect = tmp(2,:)./tmp(3,:);
fprintf('Our transformed rectangle:\n'); disp([dataRef.xRect; dataRef.yRect]);
fprintf('Transforming difference:\n'); disp([dataRef.xRect - dataOut.xRect; dataRef.yRect - dataOut.yRect]);
else
fprintf('Result file homography.mat not found\n\n');
end
Your homography result:
    1.1687   -0.4804  209.9714
    0.4346    0.6813  -30.7064
    0.0005    0.0001    1.0000

Our homography result:
    0.6486   -0.5466  242.7290
    0.2219    0.3673   22.9926
   -0.0002   -0.0006    1.0000

Your transformed rectangle:
  398.4688  385.2372  334.7934  348.2737
  180.0702  197.0198  179.7839  162.3101

Our transformed rectangle:
  406.8251  396.3648  343.2060  354.7411
  180.3197  198.2280  179.1135  161.9064

Transforming difference:
    8.3563   11.1276    8.4126    6.4675
    0.2495    1.2082   -0.6704   -0.4037

kontrola sledovani
cv09; method = 'klt';
data.xRect = [ 90 90 140 140]; data.yRect = [ 30 80 80 30];
options.ROI = [ 20 10 216 216];
options.klt_show_steps = 0;
imgPrev = im2double(imread('cameraman.tif')); [h w]=size(imgPrev);
if exist(['track_init_' method],'file') xPrev = feval(['track_init_' method],imgPrev,options);
else xPrev = track_init(imgPrev,options); end
fprintf('Found %d points of interest.\n\n',length(xPrev.x));
A = [ 1 0 -5; 0 1 -2; 0 0 1];
tmp = A \ [ data.xRect; data.yRect; ones(1,length(data.xRect)) ];
dataRef.xRect = tmp(1,:) ./ tmp(3,:); dataRef.yRect = tmp(2,:) ./ tmp(3,:);
[x y] = meshgrid((1:w)-1,(1:h)-1);
imgNew = interp2(imgPrev, A(1,1)*x+A(1,2)*y+A(1,3)+1, A(2,1)*x+A(2,2)*y+A(2,3)+1);
xNew = feval(['track_' method],imgPrev,imgNew,xPrev,options);
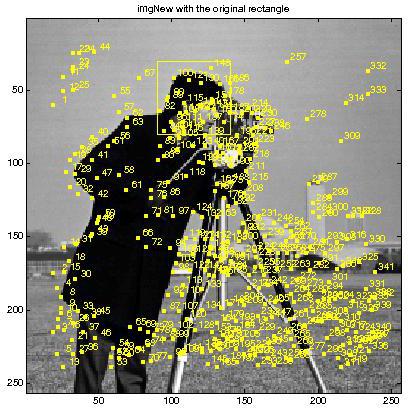
figure; imagesc(imgPrev); colormap gray; axis image; showPoints(xPrev);
line([data.xRect data.xRect(1)],[data.yRect data.yRect(1)], 'color', 'y');
title('imgNew with the original rectangle');
figure;
[dataOut xNewOut] = processMpvFrame(data,imgPrev,imgNew,xPrev,xNew,options);
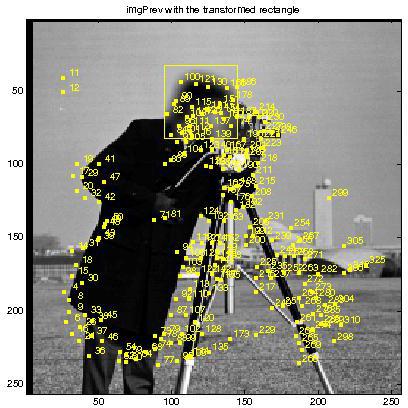
showPoints(xNew);
line([dataRef.xRect dataRef.xRect(1)],[dataRef.yRect dataRef.yRect(1)], 'color', 'y');
title('imgPrev with the transformed rectangle');
fprintf('Found %d inliers %.2f percent of tentative correspondences.\n\n', length(xNewOut.ID), 100*length(xNewOut.ID)/length(xNew.ID));
H = inv(dataOut.H / dataOut.H(3,3));
fprintf('Original transformation matrix:\n'); disp(A / A(3,3));
fprintf('Your homography matrix:\n'); disp(H / H(3,3));
fprintf('Referece rectangle:\n'); disp([dataRef.xRect; dataRef.yRect]);
fprintf('Your transformed rectangle:\n'); disp([dataOut.xRect; dataOut.yRect]);
fprintf('Transformation error:\n'); disp([dataRef.xRect - dataOut.xRect; dataRef.yRect - dataOut.yRect]);
Found 342 points of interest.


ans =

   196

Found 189 inliers 96.43 percent of tentative correspondences.

Original transformation matrix:
     1     0    -5
     0     1    -2
     0     0     1

Your homography matrix:
    1.0011   -0.0003   -5.0240
    0.0014    1.0000   -2.1108
    0.0000   -0.0000    1.0000

Referece rectangle:
    95    95   145   145
    32    82    82    32

Your transformed rectangle:
   94.9931   94.9855  145.0204  145.0410
   32.0020   82.0170   81.9870   31.9480

Transformation error:
    0.0069    0.0145   -0.0204   -0.0410
   -0.0020   -0.0170    0.0130    0.0520
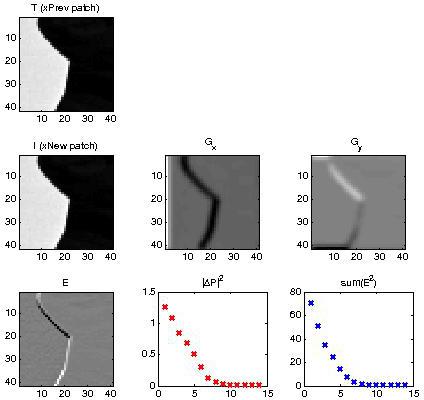
Convergence test Harris
    options.klt_show_steps = 1;
    options.klt_window = 20;
    figure;
    xPrev.x = 47; xPrev.y = 126; xPrev.ID = 4;
    xNew = feval(['track_' method],imgPrev,imgNew,xPrev,options);
    fprintf('Estimated translation: x=%2.2f y=%2.2f\n',xNew.x-xPrev.x,xNew.y-xPrev.y);
Estimated translation: x=5.00 y=1.99
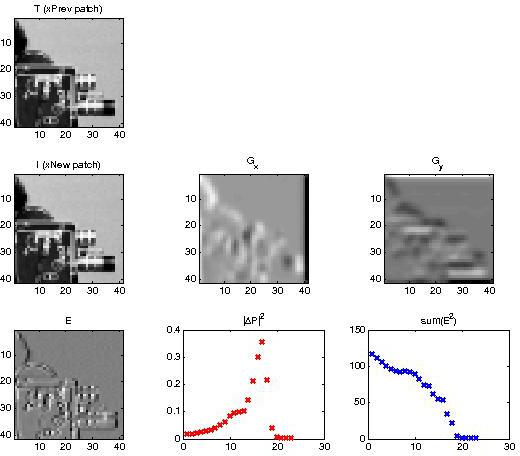
Divergence test Harris
    figure;
    xPrev.x = 153; xPrev.y = 64; xPrev.ID = 38;
    xNew = feval(['track_' method],imgPrev,imgNew,xPrev,options);
    fprintf('Estimated translation: x=%2.2f y=%2.2f\n',xNew.x-xPrev.x,xNew.y-xPrev.y);
Estimated translation: x=5.00 y=2.00
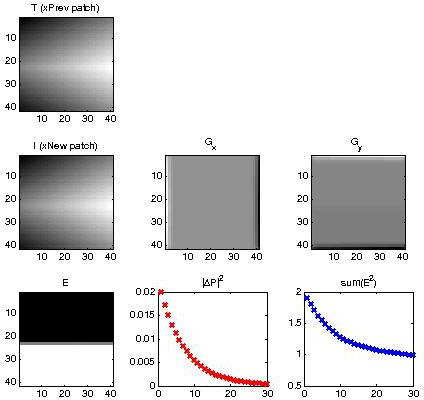
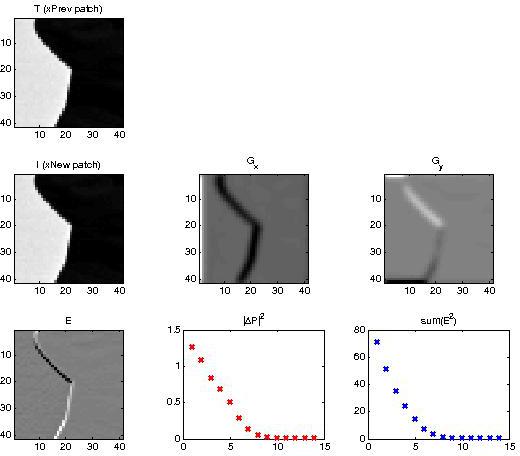
Sythetic convergence test on a linear image
    figure;
    w = 100; h = 50; [X Y] = meshgrid(1:w,1:h);
    imgPrev = (X + 2*Y) ./ (w+2*h); imgPrev = [imgPrev; flipud(imgPrev)];
    [x y] = meshgrid((1:w)-1,(1:2*h)-1);
    imgNew = interp2(imgPrev, A(1,1)*x+A(1,2)*y+A(1,3)+1, A(2,1)*x+A(2,2)*y+A(2,3)+1);
    xPrev.x = w*0.6; xPrev.y = h; xPrev.ID = 1;
    xNew = feval(['track_' method],imgPrev,imgNew,xPrev,options);
    fprintf('Estimated translation: x=%2.2f y=%2.2f\n',xNew.x-xPrev.x,xNew.y-xPrev.y);
Estimated translation: x= y=