K-Means clustering
Today we will implement the K-means clustering algorithm. The clustering will
then be used for two tasks: for estimation of parameters of a gaussian mixture,
and for unsupervised learning. The labs are rather easy, albeit there is a lot
of programing ahead. Therefore, it is recomended to go through the tasks before
the labs.
Task formulation
Part 1: K-means implementation
Implement the K-means clustering algorithm. Follow the description given for
labs in previous years [1].
Tasks:
- Download test data
data.mat, display them using ppatterns().
The file data.mat contains single variable X - 2×N matrix of 2D points.
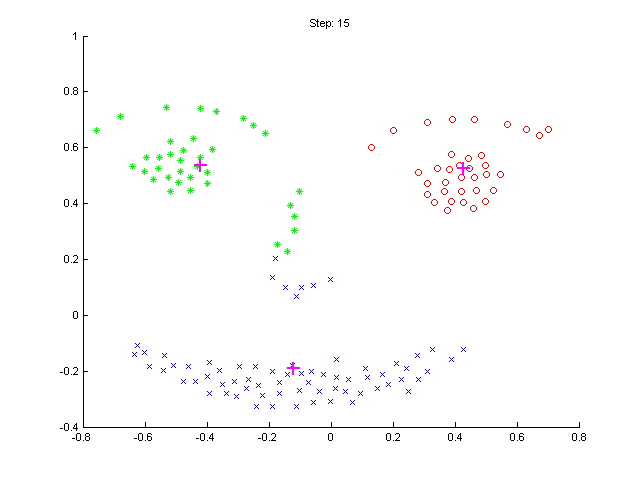
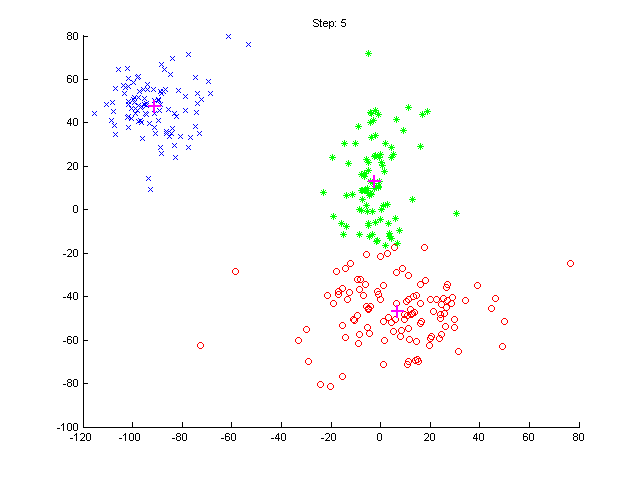
- Run the algorithm. In each iteration, display locations of means μj
and current classification of the test data. To display the classification, use
again the
ppatterns function.
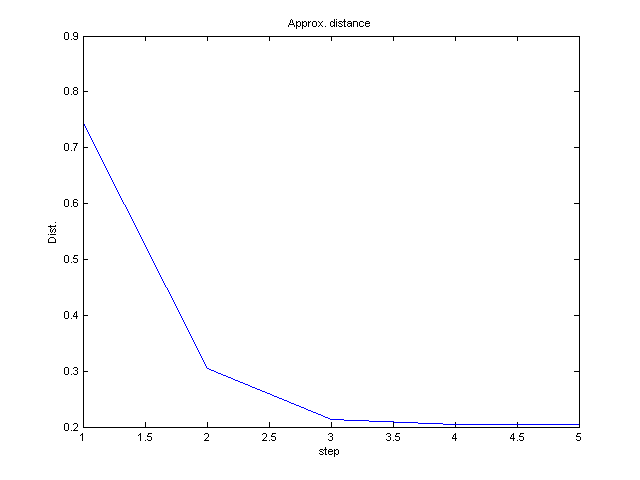
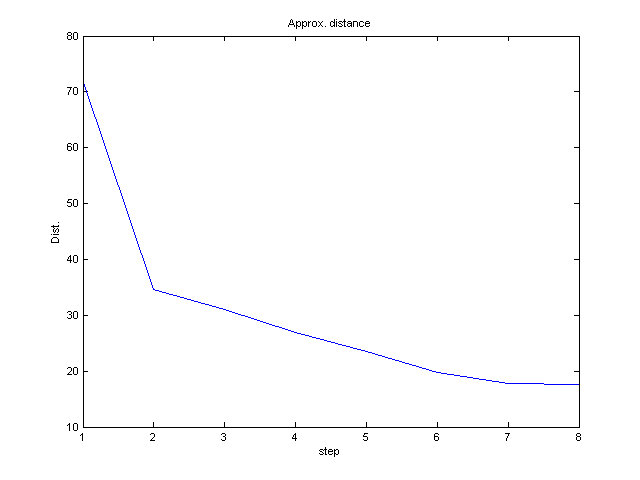
- In each iteration, plot the average distance between points and
their respective closest means μj.
- Experiment with diferent number
K of means, eg.
K = 2,3,4. Execute the algorithm repeatedly, initialise the mean values μj
with random positions. Use the function rand.
Task 2: Estimation of parameters of a gaussian mixture
Let us assume that the distribution of our data is a mixture of three gaussians:
p(x) = Sum3j=1 P(j) N( x
| μj , Σj) ,
where N(μj
, Σj) denotes a normal distribution with mean value μ j
and covariance
Σ j.
P(j) denotes the weight of j-th
gaussian within the mixture. The task is, for given input data x1 , x2
, ... , xN, to estimate the mixture parameters μ j
, Σ j , P(j) .
Tasks:
- In each iteration of the implemented k-means algorithm, reestimate means μ j
and covariances Σ j
using the maximal likelihood method. P(j)
will be the relative number (percentage) of data points classified to j-th
cluster.
Note:
To remind you of the maximal likelihood
(ML) estimation, see the
corresponding labs.
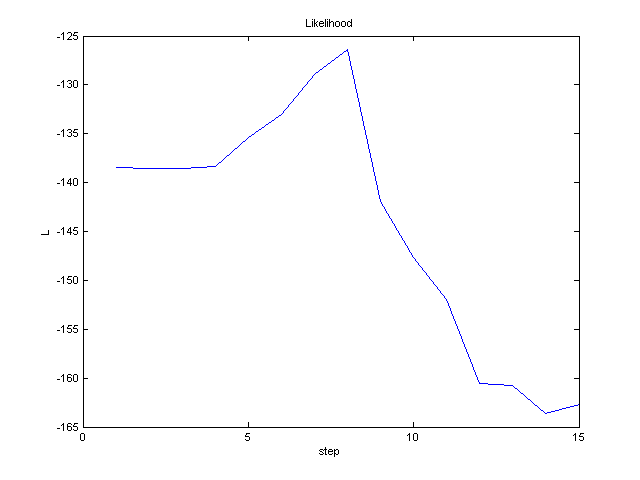
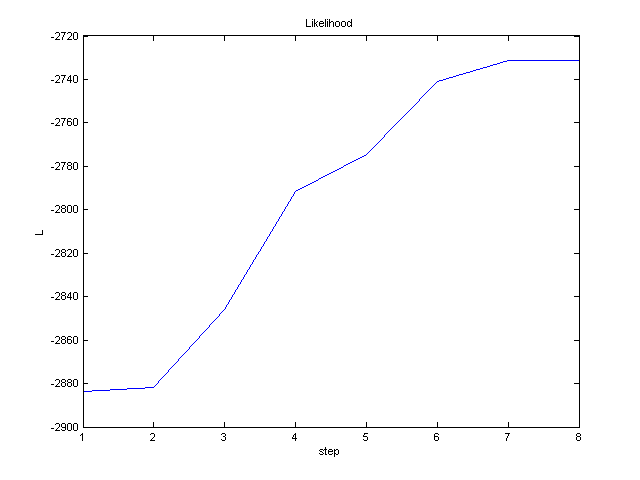
-
In each iteration, plot the total likelihood L
of estimated parameters μ j
, Σ j , P(j) :
L = log ΠNi=1 Sum3j=1
P(j) N(xi , μj , Σj) To
compute the likelihood L of a gaussian mixture, you can use likelihood
function.
Note:
If you compute the likelihood using the provided function, you should
understand how does it work, how are the formulas derived.
Task 3: Unsupervised learning
Apply the K-means clustering to the problem of "unsupervised
learning". The input consists of images of three letters, H, L, T. It is not
known, which letter is shown in which images. The task is to classify the images
into three classes. The images will be described by the two usual measurements:
x =
(sum of pixel intensities in the left half of the image) - (sum of pixel
intensities in the right half of the image)
y =
(sum of pixel intensities in the upper half of the image) - (sum of pixel intensities in the
lower half of the image)
Tasks:
- Download the images of letters image_data.mat,
compute measurements x and y.
- Using the k-means method, classify the images into three classes. In each
iteration, display the means
μj , current classification, and the likelihood L .
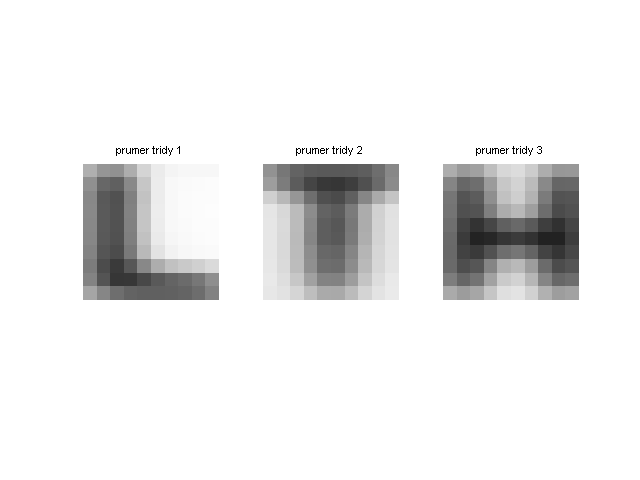
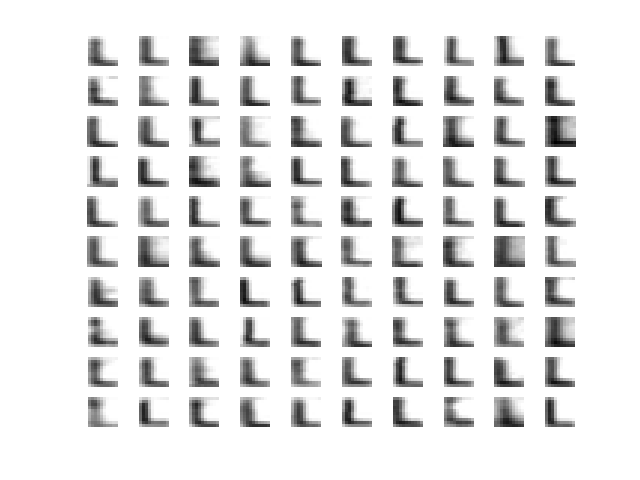
- After the iteration stops, compute and display the average image of each
of the three classes. To display the final classification, you can use
show_class function.
- Do you understand, why is it called "unsupervised" learning?
Visualisation of classification by show_class:
References
[1] Labs (2005)
Created
by Martin Urban, last update 18.7.2011