Neyman-Pearson Task
You're a captain of a merchant ship on the Caribic Sea. The journey
should be safe -- for many years, a pirate ship has not been
seen. Despite this you have a bad feeling and you are scanning the
horizon constantly. You can see a lot of unknown ships. What if one of
them belongs to the horrible Pirate of Caribic?
 |
 |
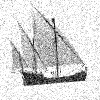
| Fig.1 Merchant ship |
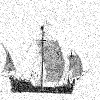
Fig.2 Pirate ship |
To simplify your task, we assume that a one-dimensional discrete
measurement
x = round( (average intensity of the left half of the image) - (average intensity of the right half of the image) )
is used to distinguish between merchant and pirate
ships. From the Sailing Guide, you know the probability distribution
P(x|1) of this quantity for merchant ships and P(x|2) for pirate
ships. However, you have no idea at all what the prior probabilities
P(1) and P(2) of encountering the ships are. Your task is to find a
decision strategy q(x) such that the probability of false alarm is
minimized and the probability of failing to see a pirate ship is
less than a reasonable threshold, ε.
Let the decision strategy be a function q such that
q(x) = 0 ... for x class 1 (a merchant ship)
q(x) = 1 ... for x class 2 (a pirate ship),
Then the conditional probability of false alarm reads
Sum_x q(x) P(x|1)
and the conditional probability of failing to see a pirate ship reads
Sum_x [1-q(x)] P(x|2)
Neyman-Pearson task means to find a strategy
q =
argmin_q Sum_x q(x) P(x|1) subject to
Sum_x [1-q(x)] P(x|2) <= ε.
Assignment
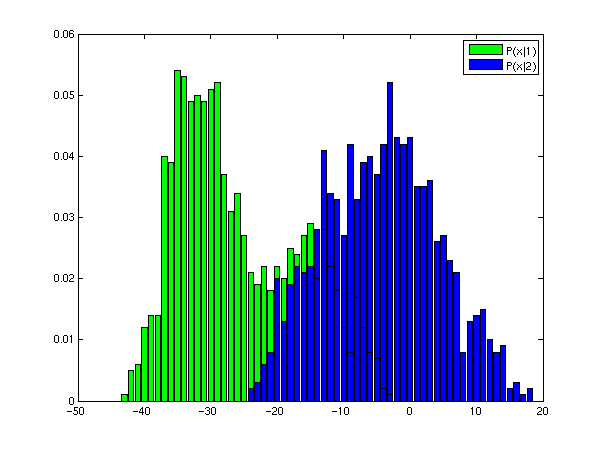
- Load the file neyman-pearson-pxi.mat into Matlab. This file contains the discrete distributions P(x|1), P(x|2):
|
Px1 |
- |
1x62, discrete distribution P(x|1) |
|
Px2 |
- |
1x62, discrete distribution P(x|2) |
|
X |
- |
1x62, set X, the set of values of x; X = {-43,-42,...,18} |
- Plot distributions P(x|1) and P(x|2) to a single plot.
- Formulate finding the optimal strategy q(x) as a linear programming task.
- Find an optimal strategy for a chosen threshold ε. To solve the linear programming, use the Matlab function
α = LINPROG(f,A,b,Aeq,beq,LB,UB),
which minimizes
f' * α
subject to
A * α <= b, Aeq * α = beq, LB <= α <= UB.
- Depict the found optimal strategy to the figure with the distributionsP(x|1) and P(x|2).
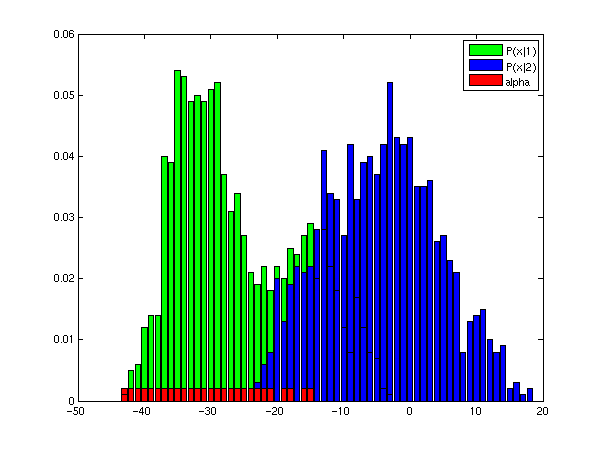
fig.4. An example of possible result. The red bars mark the bins that are classified as class 1 (merchant ship).
- For the optimal strategy, evaluate the probability of false
alarm and the probability of failing to see a pirate ship.
- Download the file neyman-pearson-images.mat, containing pictures of observed ships:
|
images |
- |
100x100x110, 110 images of ships |
|
labels |
- |
1x110, vector with correct classification |
Classify the images using the computed optimal strategy. By comparison with the true classification, (the vector labels), compute empirical errorsy (i.e. the portion of false alarms and the portion of failures to decetd a pirate ships). Compare the empirical errors with the expectations of the errors from item 6.
- Repeat items 4-7 for several different values of ε. Write the computed expected errors and the measured empirical errors to a table.
Bonus Assignment
Solve items 3-8 as Wald's (rather than Neyman-Pearson) task.
Recommended literature
Created
by Martin Urban, last update 18.7.2011