Online Camera-LiDAR Calibration Monitoring and Rotational Drift Tracking

J. Moravec and R. Šára, "Online Camera–LiDAR Calibration Monitoring and Rotational Drift Tracking," in IEEE Transactions on Robotics, vol. 40, pp. 1527-1545, 2024, doi: 10.1109/TRO.2023.3347130.


ICRA 2024


Session: Calibration and Identification I, Thu 16 May, CC - 313
Graphical Abstract: here
Presentation: here
Poster: here
Video Presentation:

IEEE Transactions on Robotics


IEEE link: here
Abstract:

The relative poses of visual perception sensors distributed over a vehicle's body may vary due to dynamic forces, thermal dilations, or minor accidents. This article proposes two methods, Online CAlibration MOnitoring (OCAMO) and LTO, that monitor and track the LiDAR–camera extrinsic calibration parameters online. Calibration monitoring provides a certificate for reference-calibration parameters validity. Tracking follows the calibration parameters drift in time. OCAMO is based on an adaptive online stochastic optimization with a memory of past evolution. LTO uses a fixed-grid search for the optimal parameters per frame and without memory. Both methods use low-level point-like features, a robust kernel-based loss function, and work with a small memory footprint and computational overhead. Both include a preselection of informative data, which limits their divergence. The statistical accuracy of both calibration monitoring methods is over 98%, whereas OCAMO monitoring can detect small decalibrations better, and LTO monitoring reacts faster on abrupt decalibrations. The tracking variants of both methods follow random calibration drift with an accuracy of about 0.03° in the yaw angle.
(© IEEE)

Keywords:

Calibration and identification, computer vision for transportation, LiDAR–camera systems, sensor fusion.

GitHub: here


Supplementary material


In [4], they discovered a decalibration on a highway sequence from the KITTI dataset [44]. The segment in question is Sequence 01 from the odometry dataset (2011_10_03_drive_0042_sync in raw data). We have analyzed this case thoroughly. Some of the results are reported only in here, and the main finding is included in Section VI.D.

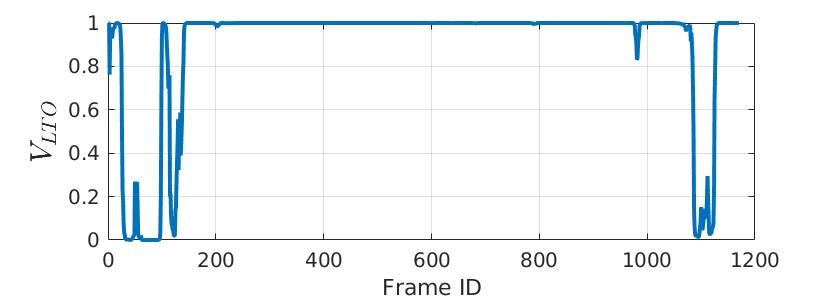
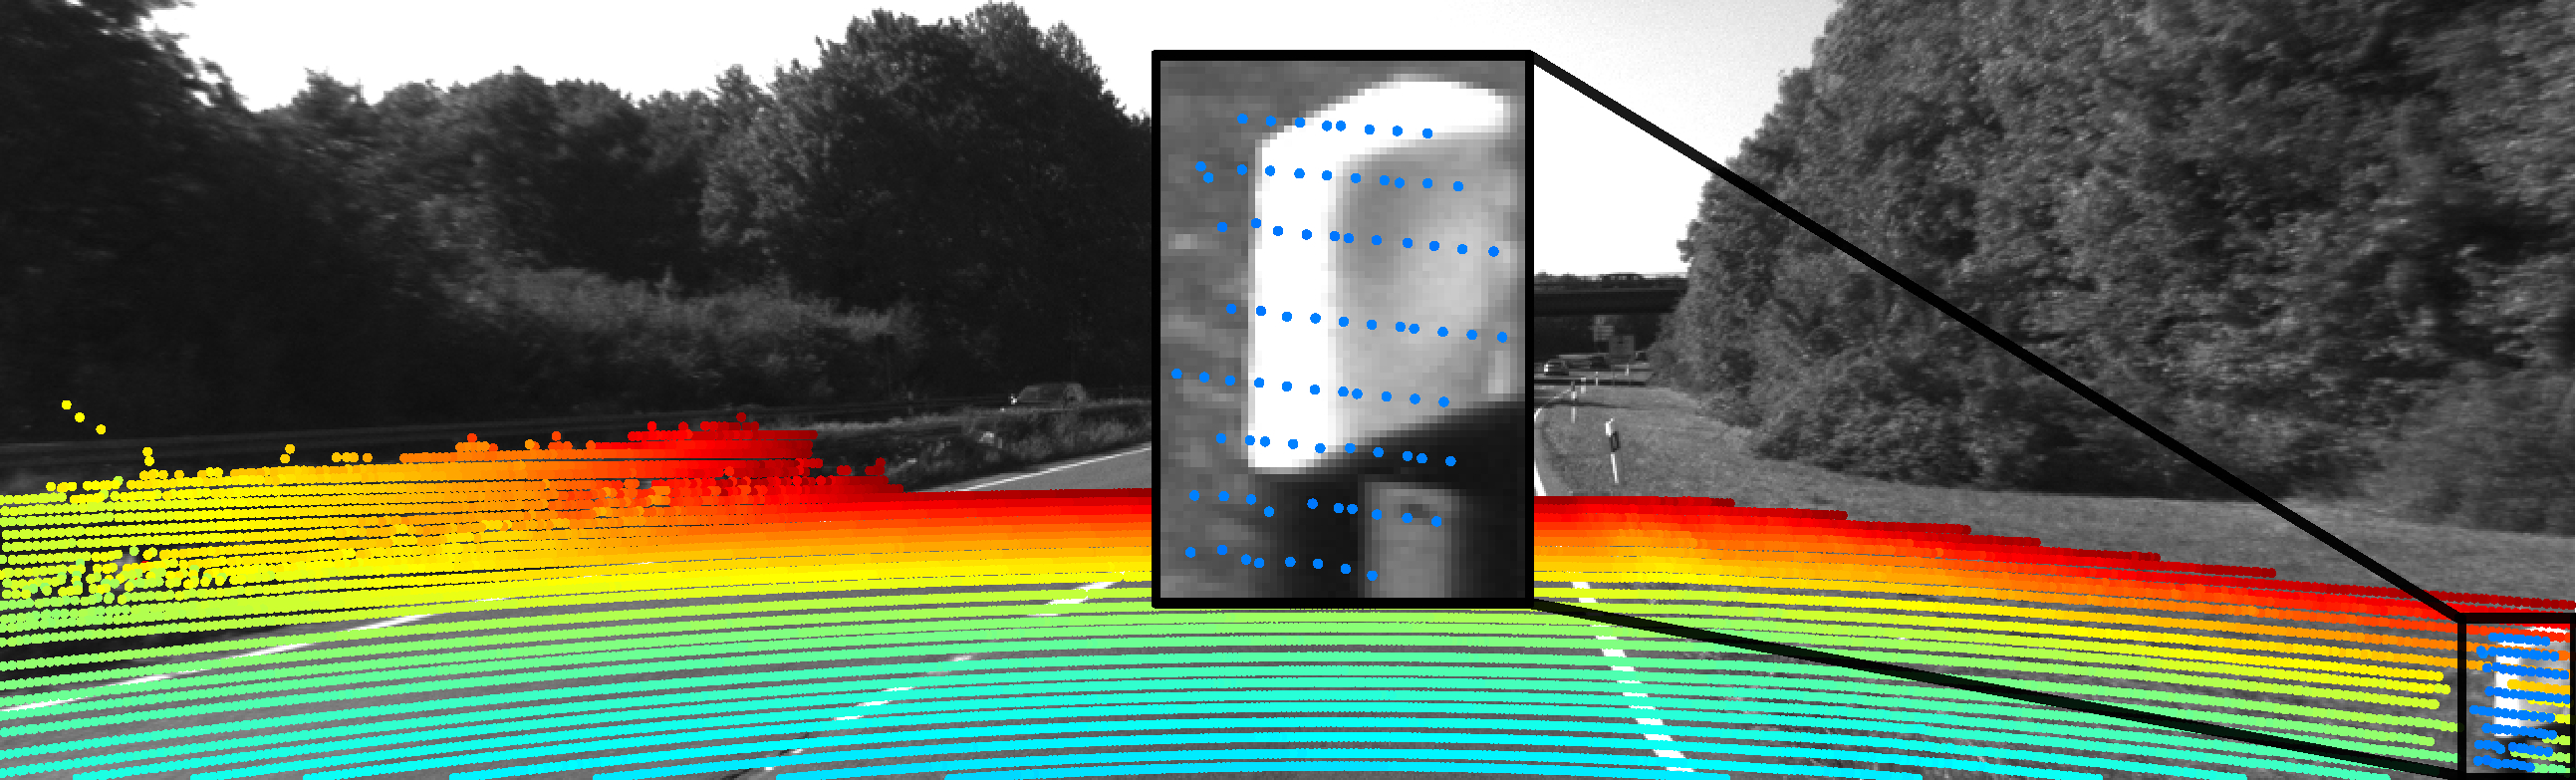
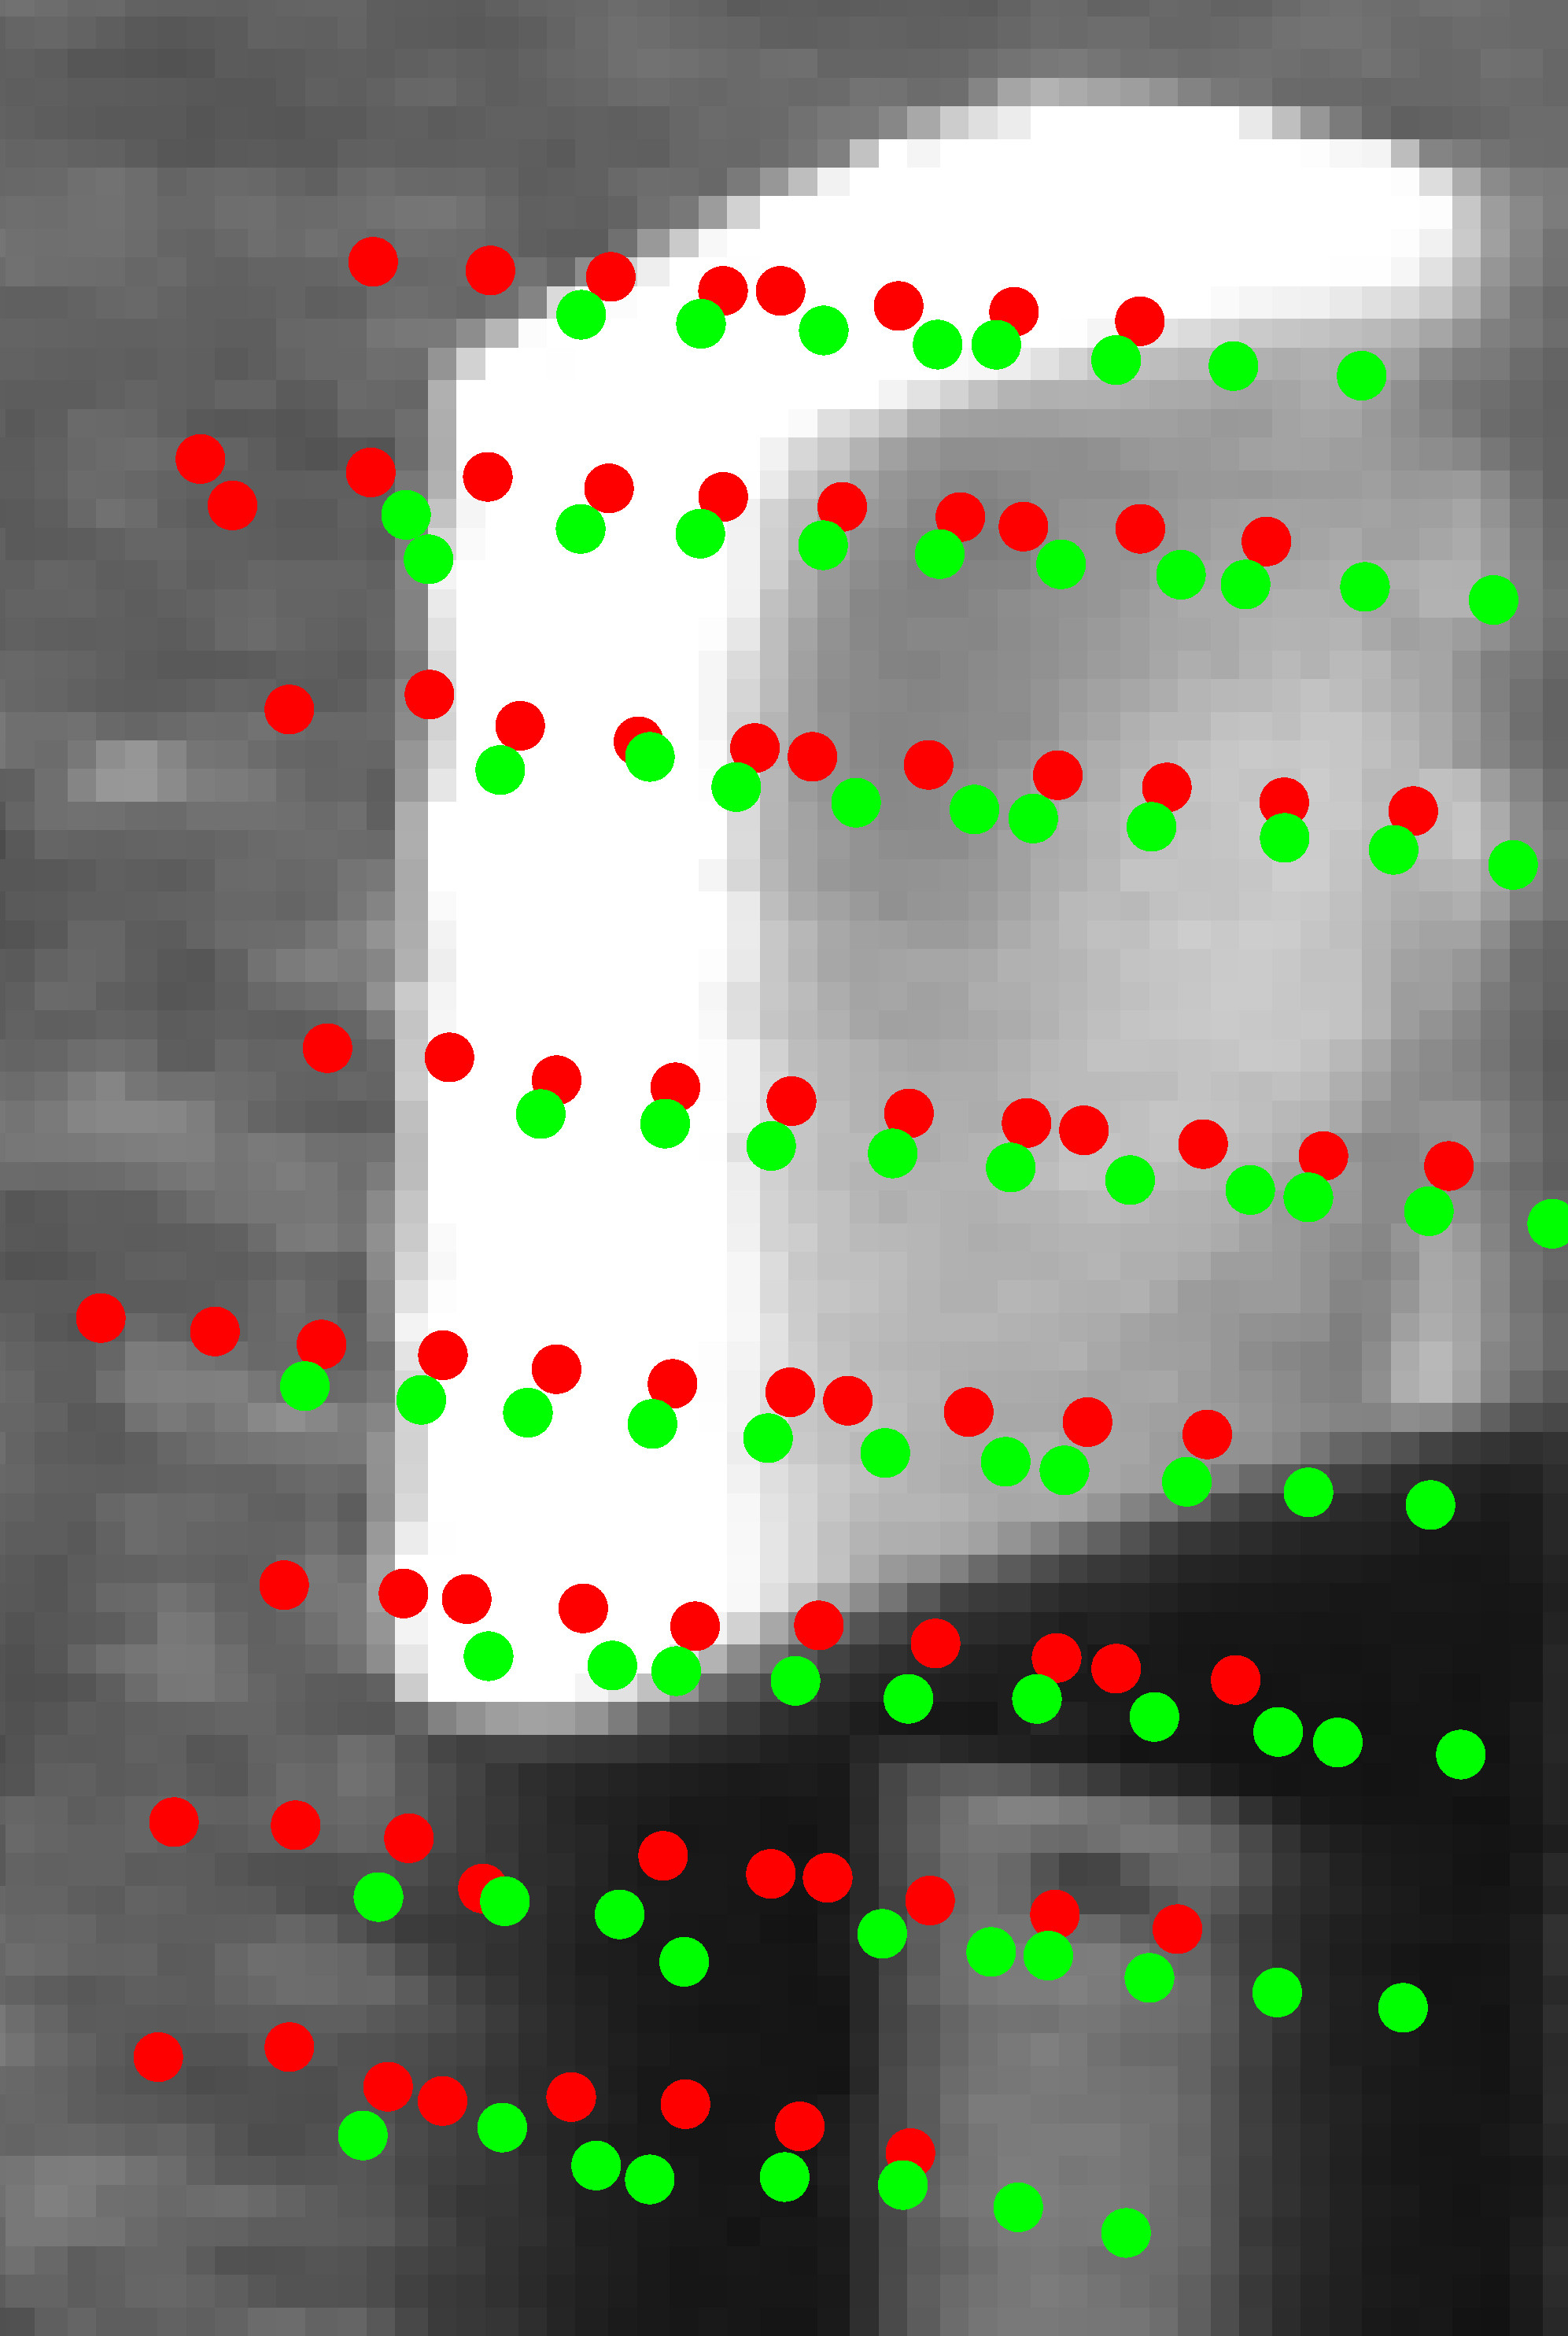
We computed the LTO calibration validity index V LTO on this sequence. The result is shown in Fig. 1. The plot shows a detected decalibration on similar parts (start and end) of the sequence as in the reference [4]. The pointcloud projection onto the image plane of Camera 0 (see Fig. 2) suggests that there might be some actual decalibration between the LiDAR and the camera on this frame from the beginning of the sequence. Although we did find a medium Spearman rank correlation of -0.45 between the validity index and the forward acceleration of the vehicle, we cannot make any strong conclusions on the cause of the decalibration. We believe, there are other possible explations of this behaviour besides the actual decalibration of rotational parameters due to the forces.

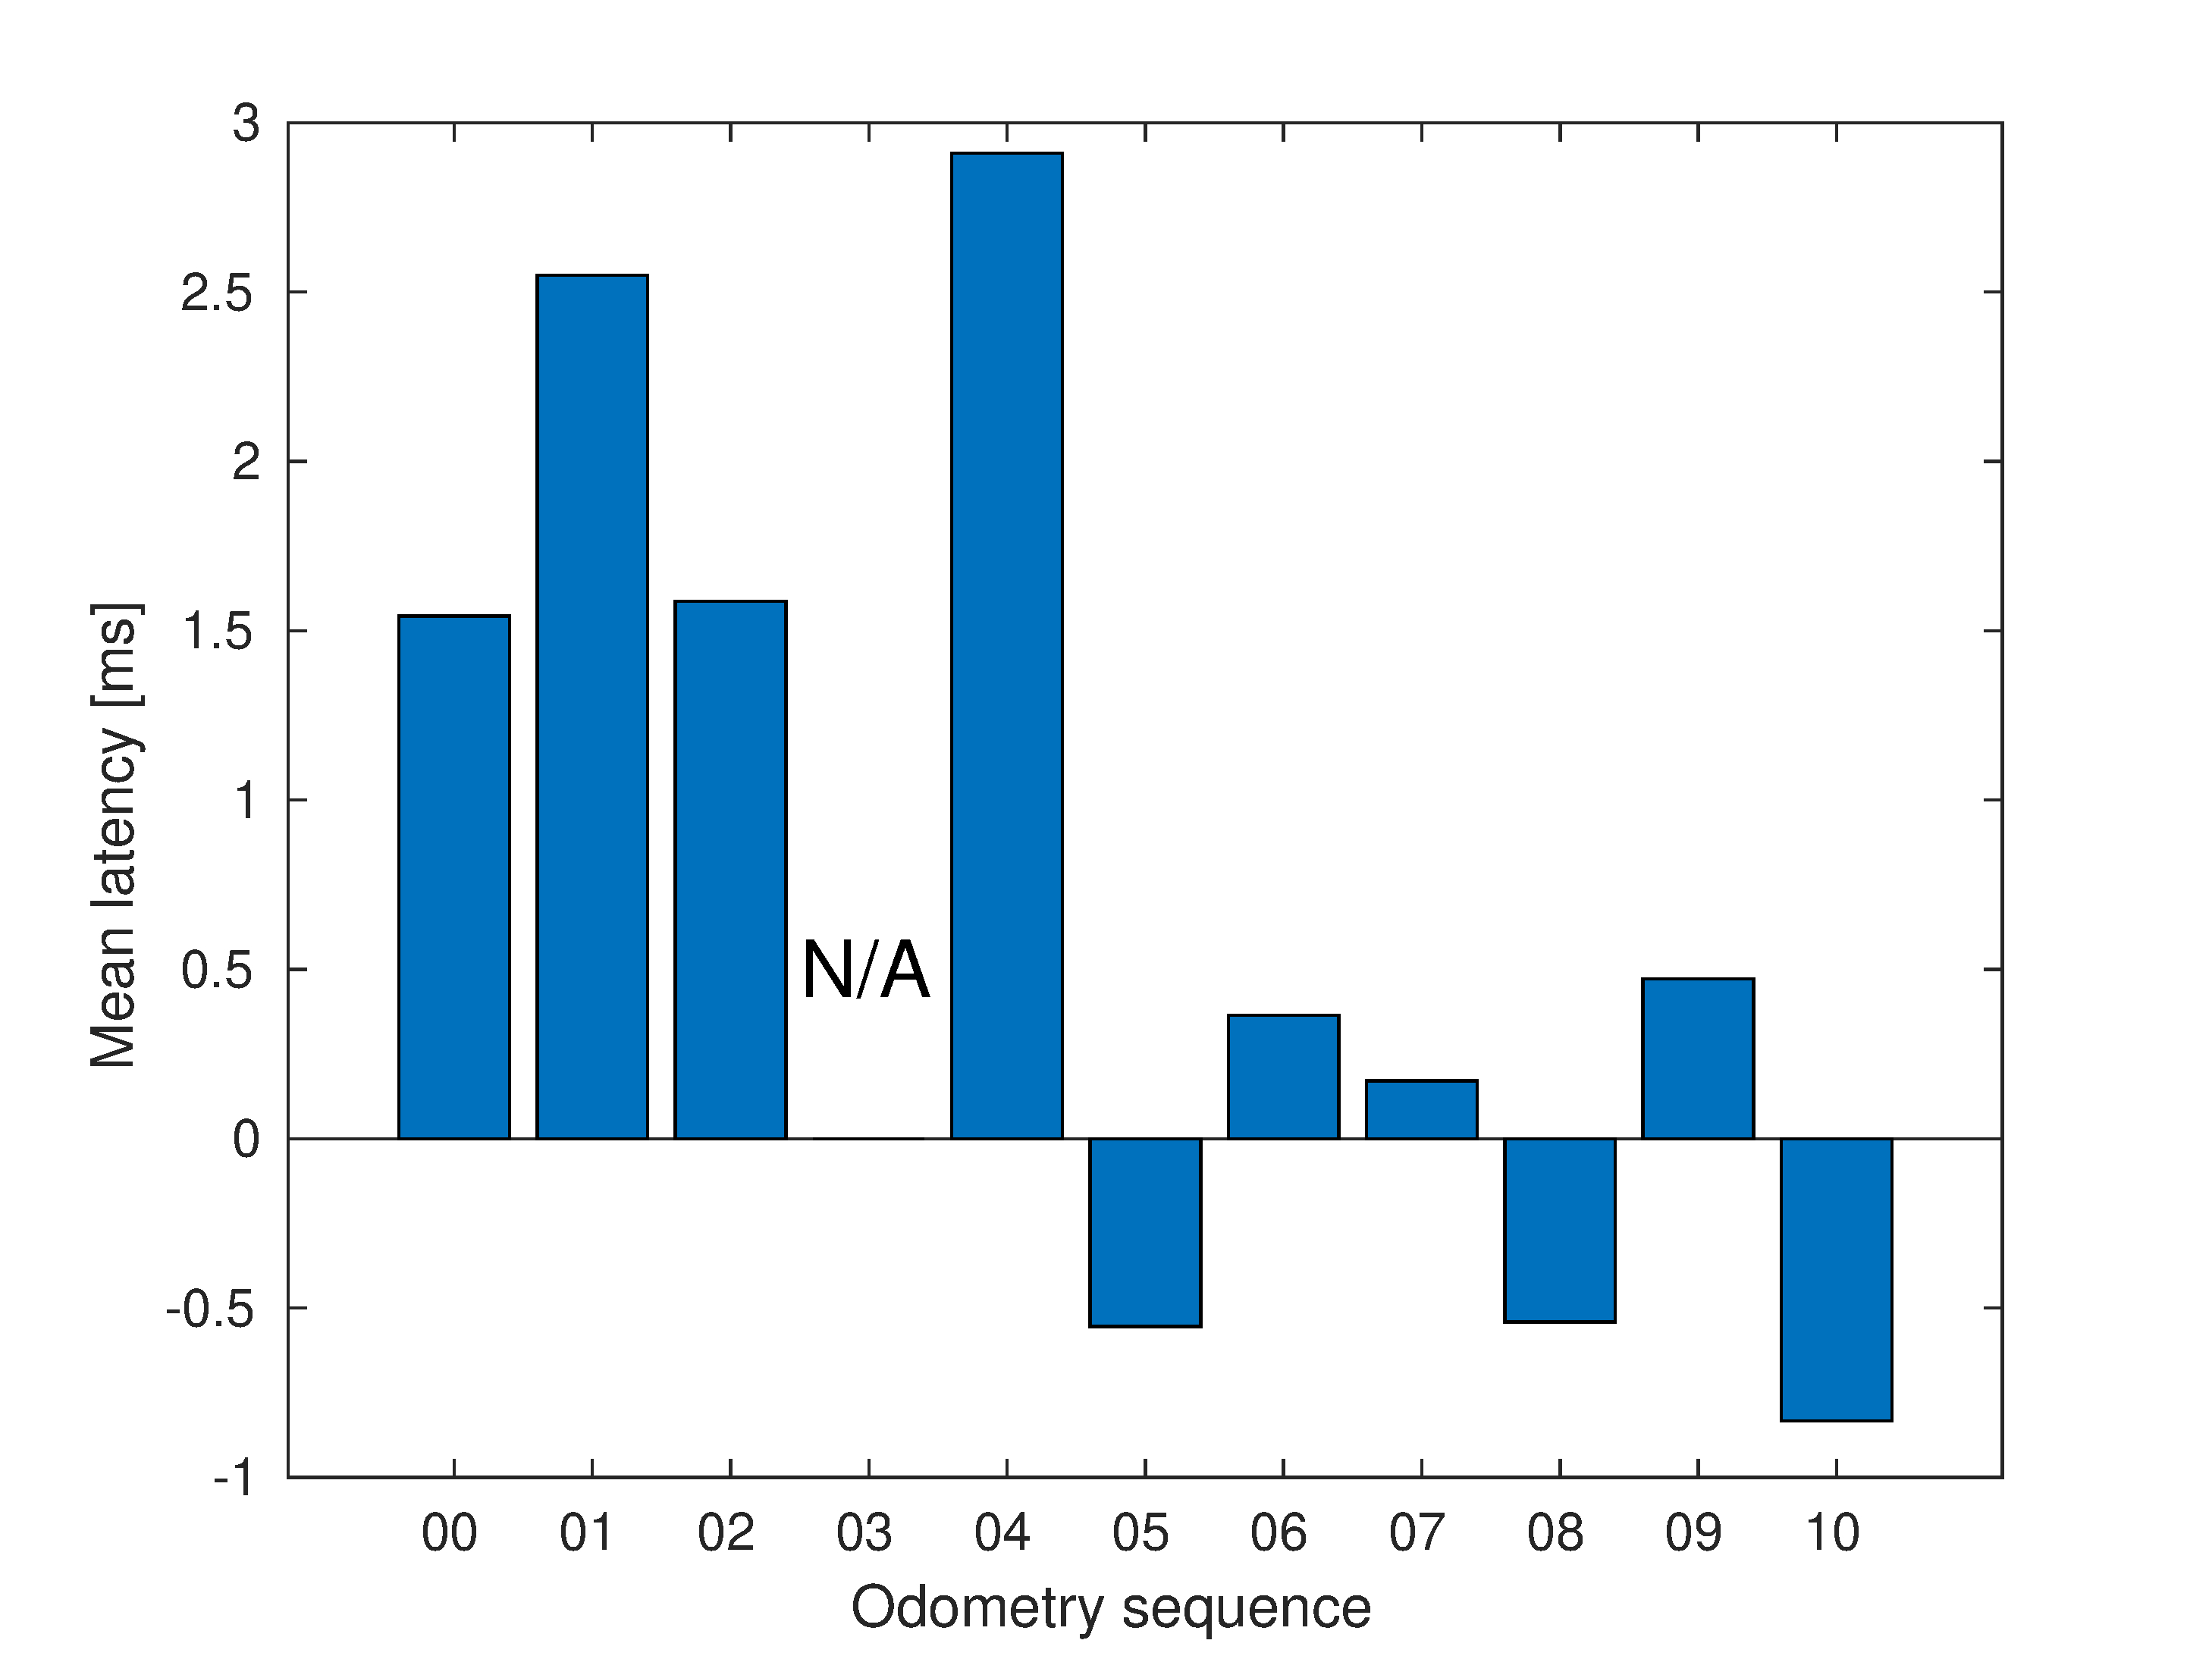
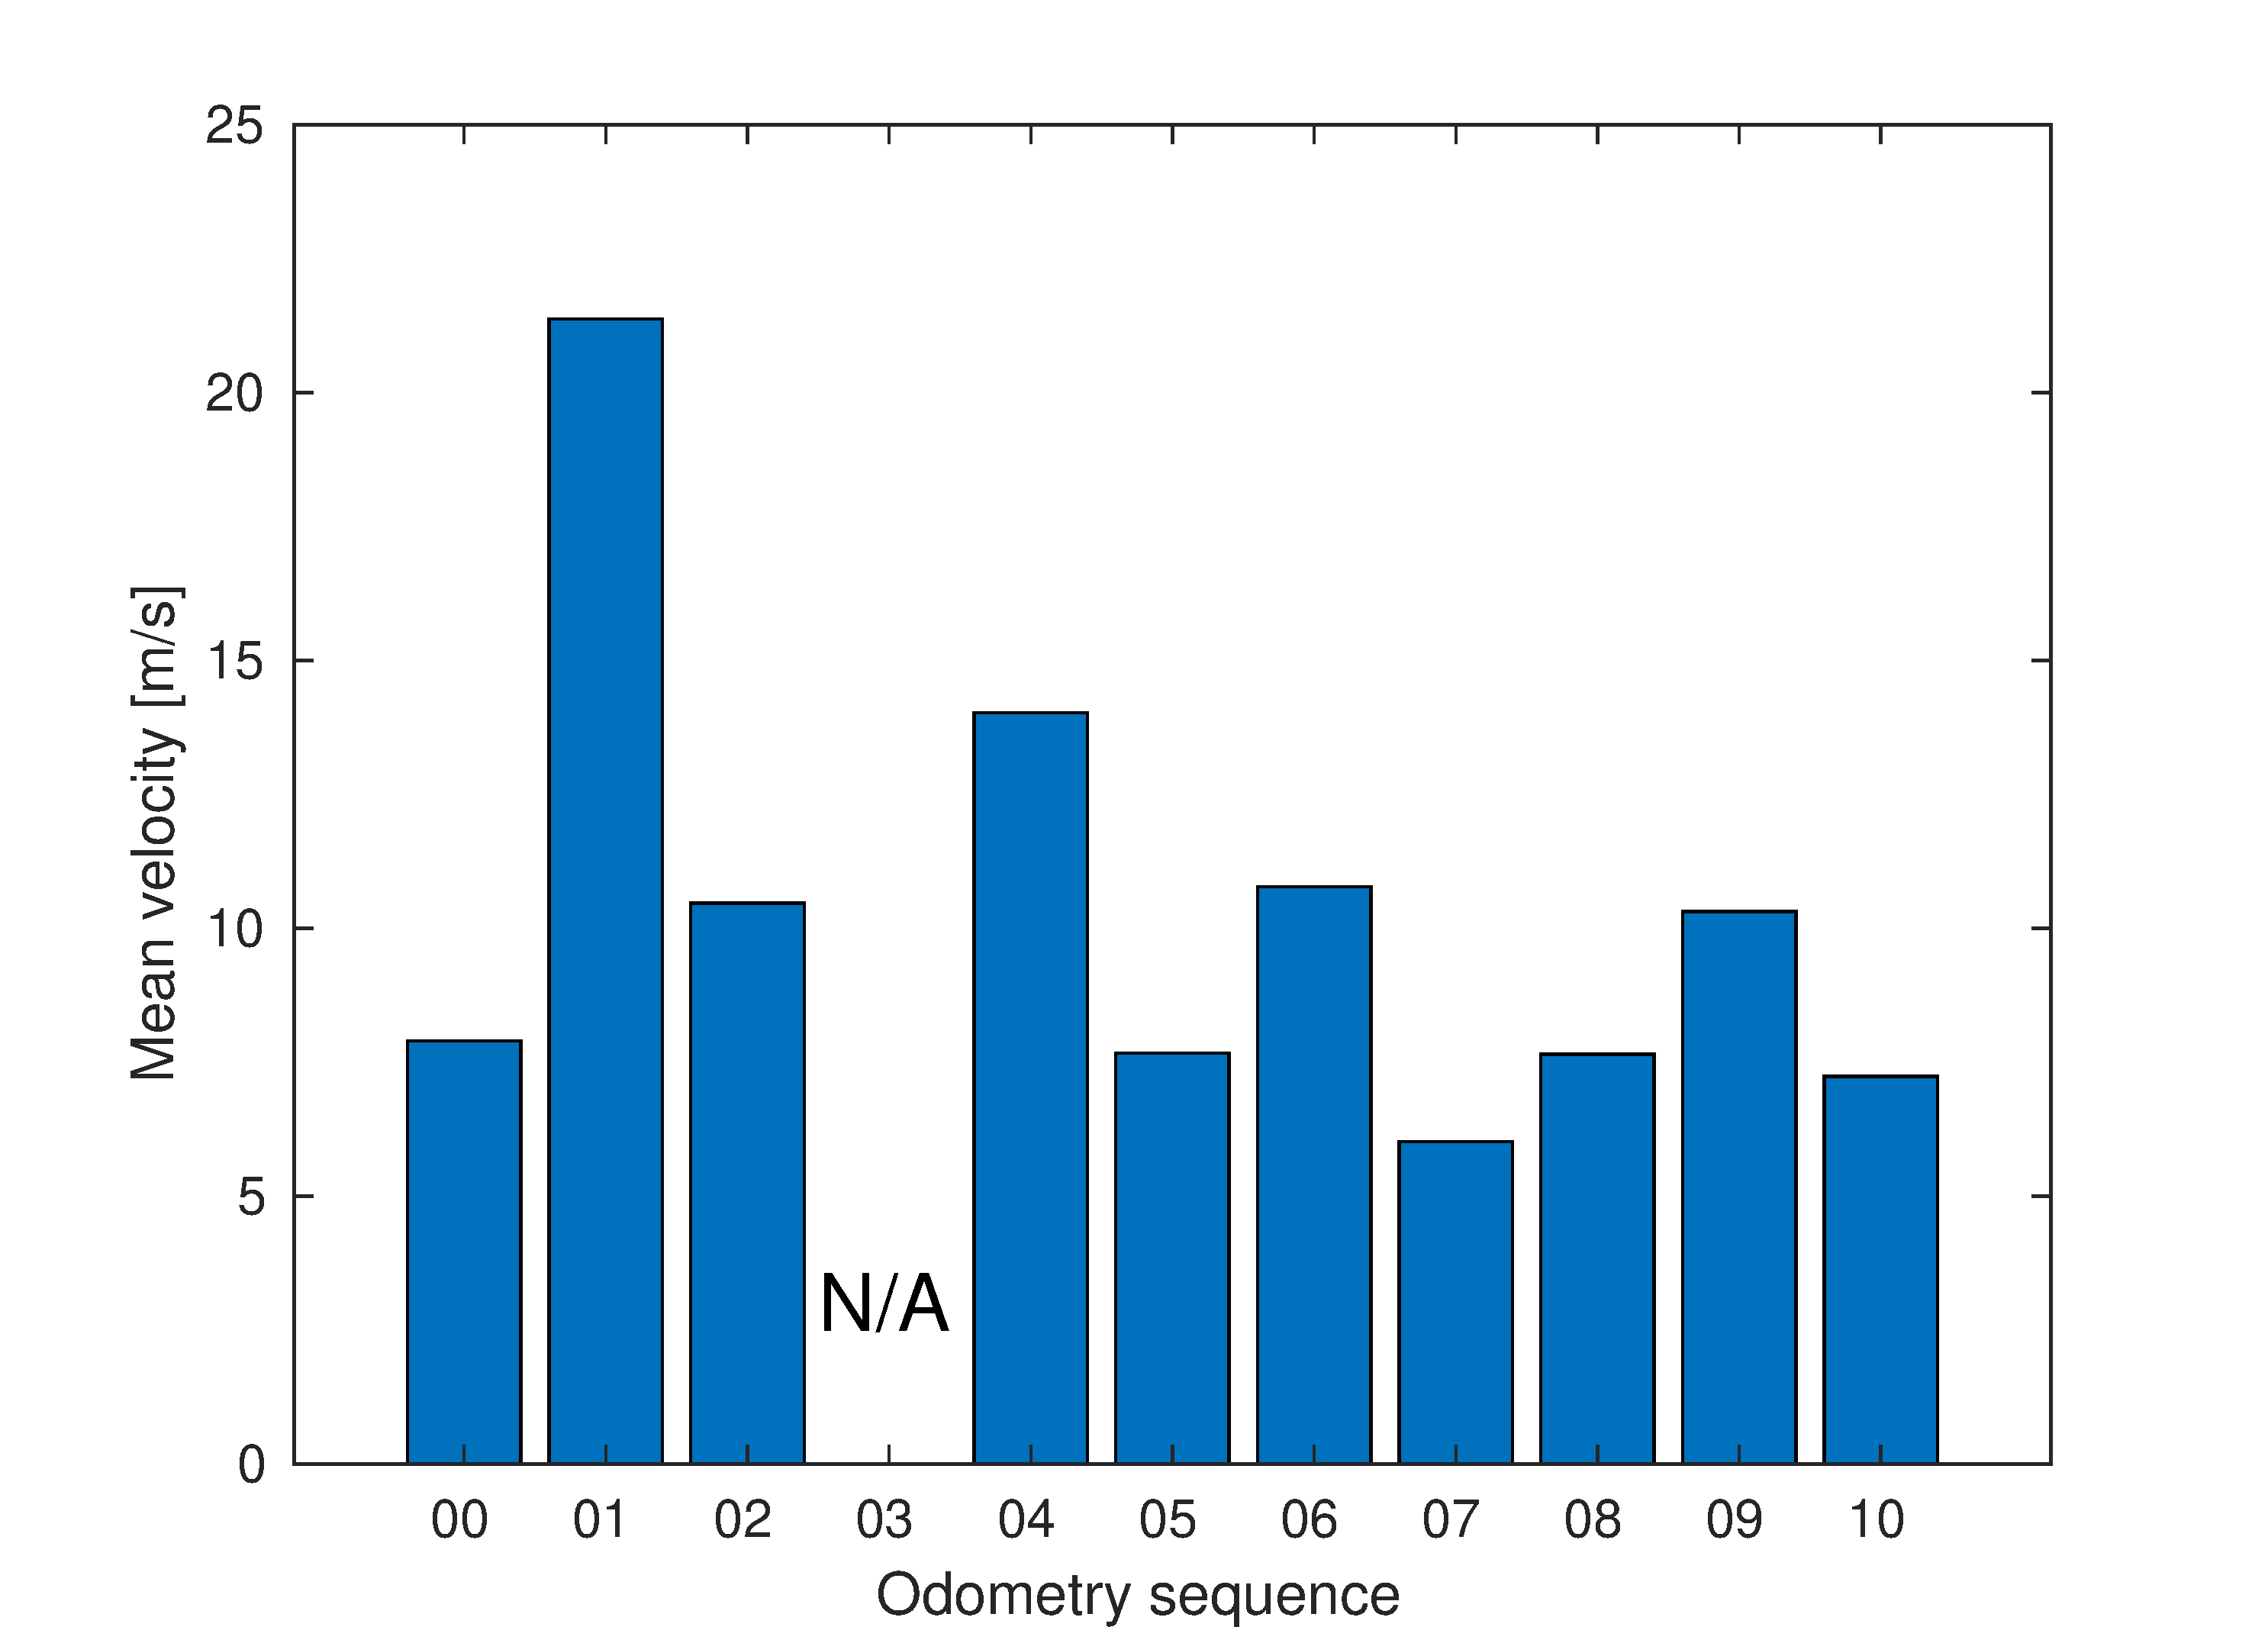
For example, in the case of LiDARs with cameras, the effect of uncompensated relative latency might have influence in combination with the high velocity on the highway. For each KITTI odometry dataset sequence (besides 03, which is not available in the raw dataset anymore), we ran an optimisation procedure on the loss function (see Eq. (3)) that estimated the relative latency. The results are shown in Fig. 3. One can see that Sequences 01 and 04 exhibited the largest mean latency (the latency is changing dynamically throughout each sequence). We have also ploted the velocity based on the IMU data in Fig. 4. One can see that the highway sequence has the highest mean velocity and a very high latency. This combination could lead to some decalibration on particular parts of the sequence. Fig. 5 shows that latency compensation by 5 ms fixed the error (seen above in Fig. 2) of LiDAR points projection on the bollard.

[4] I. Cvisic, I. Markovic, and I. Petrovic, "SOFT2: Stereo visual odometry for road vehicles based on a point-to-epipolar-line metric," IEEE Transactions on Robotics, vol. 39, no. 1, p. 273-288, 2023.

[44] A. Geiger, P. Lenz, C. Stiller, and R. Urtasun, "Vision meets robotics: The KITTI dataset," International Journal of Robotics Research, vol. 32, no. 11, p. 1231-1237, 2013.


LTO monitoring Sequence 01
Fig. 1: LTO calibration monitoring on Sequence 01.
Example projection Sequence 01
Fig. 2: An example of a slight decalibration on a bollard in the Sequence 01 from Odometry dataset. Notice that the projected LiDAR points extend past the edge of the bollard, demonstrating a decalibration. Only points within 20 m from the LiDAR are visualised.
Latency in KITTI odometry dataset
Fig. 3: Mean latency in odometry dataset.
Velocity in KITTI odometry dataset
Fig. 4: Mean velocity in odometry dataset.
Latency compensation in KITTI odometry dataset
Fig. 5: The efffect of latency compensation on a bollard.