


Next: Refining structure and motion
Up: Relating to other views
Previous: Relating to other views
Contents
Figure 5.4 shows one of the images of the sphere sequence and the recovered camera calibration together with the tracked points. This calibration can then be used to generate a plenoptic representation from the recorded images (see Section 8.3).
Figure 5.4:
Image of the sphere sequence (left) and result of calibration step (right). The cameras are represented by little pyramids. Images which were matched together are connected with a black line.
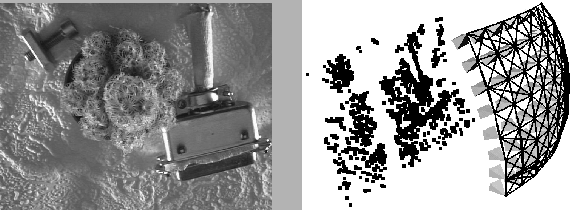 |
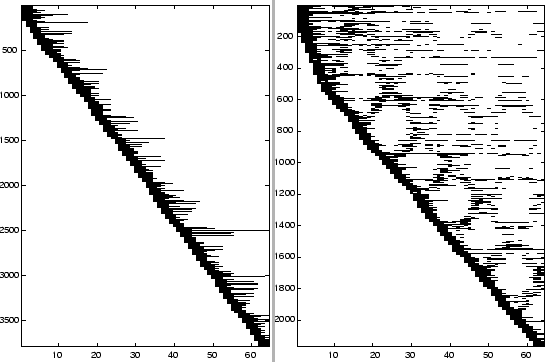
Figure 5.5 shows all the images in which each 3D point is tracked. The points are in the order that they were instantiated. This explains the upper triangular structure. It is clear that for the sequential approach, even if some points can be tracked as far as 30 images, most are only seen in a few consecutive images.
From the results for the extended approach several things can be noticed. The proposed method is clearly effective in the recovery of points which were not seen in the last images, thereby avoiding unnecessary instantiations of new points (the system only instantiated 2170 points instead of 3792 points). The band structure of the appearance matrix for the sequential approach has been replaced by a dense upper diagonal structure. Some points which were seen in the first images are still seen in the last one (more than 60 images further down the sequence). The mesh structure in the upper triangular part reflects the periodicity in the motion during acquisition. On the average, a point is tracked over 9.1 images instead of 4.8 images with the standard approach.
Figure 5.5:
Statistics of the sphere sequence. This figure indicates in which images a 3D point is seen. Points (vertical) versus images (horizontal). The results are illustrated for both the sequential approach (left) as the extended approach (right) are illustrated.
 |
Comparison with ground-truth data shows that the calibration accuracy was improved from 2.31% of the mean object distance to 1.41% by extending the standard structure and motion technique by scanning the viewpoint surface as described in this section.
Next: Refining structure and motion
Up: Relating to other views
Previous: Relating to other views
Contents
Marc Pollefeys
2000-07-12